Has your application ever crashed in the middle of the night, leaving you scrambling for answers? Keeping your applications running smoothly in the cloud is a perpetual challenge. A significant part of that challenge lies not just in reacting to user complaints, but in truly understanding what’s happening under the hood. This is where effective cloud app monitoring comes into play. Without it, you’re essentially flying blind, unable to proactively identify and resolve issues before they impact your customers and your business.
Understanding the Pillars: Metrics, Tools, and SRE

At its core, cloud app monitoring revolves around three interconnected pillars: collecting the right metrics, utilizing effective tools to visualize and analyze those metrics, and embedding a Site Reliability Engineering (SRE) mindset into your operations.
The Foundation: Essential Metrics
What exactly should you be monitoring? While the specific metrics will vary depending on your application’s architecture and business goals, some are universally critical:
- Availability: Is your application up and accessible? If users can’t access your app, nothing else matters. This often translates to uptime percentages, successful request rates, and can be further refined by Mean Time To Detect (MTTD) and Mean Time To Recovery (MTTR) for incident response.
- Performance: How fast is your application responding? Key Performance Indicators (KPIs) here include request latency (both client-side and server-side), transaction times, and throughput. High latency can often be a leading indicator of deeper issues.
- Resource Utilization: Are your underlying cloud resources being used efficiently? This involves monitoring application-level metrics like CPU utilization, memory usage, network traffic, and disk I/O. Also, one must consider saturation, which indicates if a resource is nearing its capacity limits.
- Error Rates: How often are requests failing? Beyond just HTTP 5xx errors (server-side issues), monitoring application-specific errors (e.g., database connection failures, business logic exceptions) is paramount. Distinguish between hard errors (failures) and soft errors (warnings or partial failures) for nuanced insights.
- User Experience: Beyond purely technical metrics, how is the end-user truly perceiving your application? This includes frontend performance, page load times, and can be assessed through Real User Monitoring (RUM) or synthetic monitoring (simulating user journeys). Remember, user satisfaction scores are lagging indicators; focus on leading indicators of user pain.
These metrics, when collected and analyzed effectively, provide the essential data points to assess your application’s health.
The Arsenal: Powerful Cloud App Monitoring Tools
Fortunately, you don’t have to build these monitoring systems from scratch. The cloud ecosystem offers a plethora of powerful cloud application monitoring tools, each with its strengths. Some of the most popular and effective include:
- CloudWatch: For AWS users, CloudWatch is a native service that provides comprehensive monitoring of your AWS resources and applications. Its strength lies in deep integration with the AWS ecosystem, allowing you to collect logs, metrics, and events, set alarms, and automatically react to changes in your AWS environment.
- Azure Monitor: For Azure users, Azure Monitor delivers a full-stack observability platform. It collects and analyzes telemetry from your Azure and on-premises environments, providing reliable solutions for Application Performance Monitoring (APM), infrastructure monitoring, log analytics, and alerting.
- Prometheus: A widely adopted open-source monitoring and alerting system designed for reliability. Prometheus excels at collecting time-series data, particularly from dynamic cloud environments like Kubernetes due to its pull-based model. Its flexible query language, PromQL, makes it powerful for analyzing trends and setting up sophisticated alerts.
- Grafana: Often used in conjunction with Prometheus (or other data sources), Grafana is an open-source analytics and visualization platform. It allows you to create beautiful, interactive dashboards from your collected metrics, making it easy to understand the health and performance of your applications at a glance. Its killer feature is its ability to unify data from disparate sources into a single pane of glass.

Integrating these tools – perhaps using Prometheus to collect metrics and Grafana to visualize them, or leveraging native platforms like CloudWatch and Azure Monitor for their respective ecosystems – provides a potent combination for gaining deep visibility into your cloud applications.
Example: A simple Prometheus configuration snippet to scrape metrics from a hypothetical web application:
# Prometheus configuration file (prometheus.yml)

scrape_configs:
  - job_name: 'my-web-app' # A descriptive name for the job
    static_configs:
      - targets: ['localhost:8080'] # The address and port where your application exposes metrics

# This configuration tells Prometheus to periodically scrape ("pull") metrics
# from the specified target (your web app) at the default interval.
# You can configure scrape_interval and scrape_timeout for more control.
The Philosophy: SRE Monitoring Best Practices
Simply deploying monitoring tools isn’t enough. To truly leverage the benefits of cloud app monitoring, you need to adopt SRE monitoring best practices. This means shifting from a reactive firefighting stance to a proactive, data-driven approach. Key SRE principles include:
- Error Budgets: Define acceptable levels of unreliability. Think of it like a monthly budget for mistakes – once it’s spent, you stop ‘spending’ on new feature development until you fix the reliability ‘leaks.’ If your application consistently exceeds its error budget, it signals that engineering effort should be shifted from new feature development to improving reliability.
- Service Level Objectives (SLOs) and Service Level Indicators (SLIs): These are the cornerstones of SRE. Clearly define what ‘good’ performance and reliability look like. SLIs are specific, quantifiable measures of service performance (e.g., ‘HTTP 200 latency’), while SLOs are target values for those SLIs (e.g., ‘99.9% of HTTP 200 requests served in under 300ms’).
- Automated Alerting: Alerts should be actionable and tied directly to SLO violations or critical error conditions. An actionable alert tells you what is wrong and where to look, not just ‘something is broken.’ Avoid noisy alerts that can lead to alert fatigue; ensure each alert has a clear owner and a documented runbook.
- Traceability and Distributed Tracing: For complex microservice architectures, understanding the flow of requests across different services is essential for debugging. Application Performance Monitoring (APM) solutions often incorporate distributed tracing to provide this end-to-end visibility..
- Observability: Go beyond just monitoring predefined metrics. Embrace observability by collecting logs, traces, and metrics in a way that allows you to ask arbitrary questions about your system’s behavior without pre-defining what you’re looking for. This is where you gain true insight into the ‘why’ behind system behavior.
By integrating these practices, you can transform your monitoring from a passive reporting mechanism into an active driver of operational excellence.
The Synergy of Application Performance Monitoring (APM)
Application Performance Monitoring (APM) tools are a specialized subset of cloud application monitoring tools that focus specifically on the performance and behavior of your applications. APM solutions typically provide:
- Deep code-level insight: They can trace transactions from the user request all the way down to the specific lines of code and database queries that are causing performance bottlenecks. This tells the story of a request, not just its statistics.
- Real-time performance metrics: This includes response times, throughput, error rates, and resource consumption at the application level.
- Dependency mapping: They help visualize the relationships between different services in your application, making it easier to understand how failures or performance issues in one service can impact others.
- User experience monitoring: Some APM tools also offer synthetic monitoring (simulating user journeys) and real user monitoring (collecting data from actual user sessions) to provide a holistic view of the user experience.
When combined with infrastructure monitoring capabilities, APM provides an unparalleled understanding of your application’s health and performance.
Putting it All Together: The SRE Approach in Action
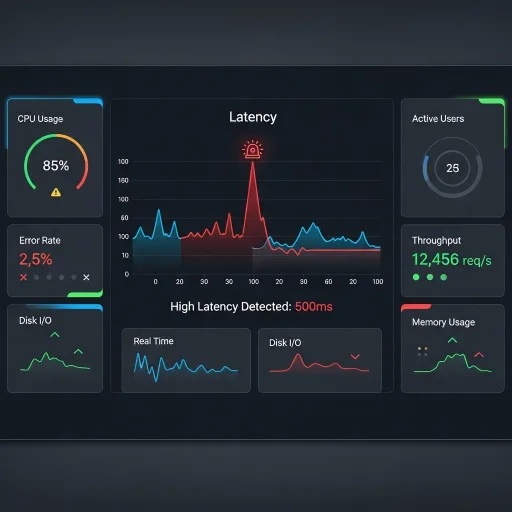
Imagine a scenario where your e-commerce checkout service is experiencing increased latency. Using your cloud application monitoring tools (like CloudWatch or Prometheus), you’d first check the overall availability and resource utilization of the service. If those look normal, you’d then drill down using APM.
The APM data might reveal that a specific database query within the checkout process is taking significantly longer than usual. You can then use Grafana to overlay this APM data with your Prometheus metrics, identifying precisely when the slowdown began and correlating it with any recent deployments or changes.
Following SRE monitoring best practices, you might have an alert configured that fires when the checkout latency exceeds your defined SLO. Sarah, the on-call SRE, felt her phone buzz with an urgent alert – checkout latency spiking! This alert would provide them with direct links to the APM traces and Grafana dashboards, enabling them to quickly diagnose and resolve the issue, perhaps by optimizing the database query or rolling back a problematic deployment.
In conclusion, effective cloud application monitoring is not just about collecting data; it’s about transforming that data into actionable insights that drive reliability. By embracing SRE principles, leveraging actionable monitoring tools, and establishing clear SLOs, organizations can proactively identify and address performance bottlenecks, minimize downtime, and ultimately deliver a superior user experience. It’s about building resilient systems that can withstand the unpredictable nature of the cloud, ensuring your cloud applications are always performing at their peak. Achieving operational excellence is the ultimate goal.
Further Reading:
Google Cloud’s Site Reliability Engineering (SRE) Workbook: A practical guide from Google that delves into the implementation of SRE principles, offering hands-on exercises and real-world scenarios to improve system reliability.
OpenTelemetry Documentation: Understand OpenTelemetry, a vendor-neutral, open-source observability framework for instrumenting, generating, collecting, and exporting telemetry data (metrics, logs, and traces).
Datadog Blog: What is Application Performance Monitoring (APM)?: A concise explanation of APM, its core components, and how it helps teams monitor and optimize the performance of their applications.
New Relic Blog: What are Golden Signals in Monitoring?: Learn about the four “golden signals” of monitoring (latency, traffic, errors, and saturation) and how they provide a high-level overview of system health and performance.
The Phoenix Project: A Novel About IT, DevOps, and Helping Your Business Win: A fictional story that provides practical insights into IT operations, DevOps, and the importance of flow, feedback, and continuous learning in improving software delivery.
Accelerate: The Science of Lean Software and DevOps: Building and Scaling High Performing Technology Organizations: This book presents groundbreaking research into the capabilities that drive high performance in technology organizations, including continuous delivery, architectural practices, and a strong culture of learning.